

Bulls Get Benefit of Doubt, But...
It's a new week, so let's start things off right with an objective review of my key market models/indicators and see where things stand. To review, the primary goal of this exercise is to try and remove any subjective notions about what "should" be happening in the market in order to stay in line with what "is" happening in the markets. So, let's get started.
The State of the Trend
We start our review each week with a look at the "state of the trend." These indicators are designed to give us a feel for the overall health of the current short- and intermediate-term trend models.

View Trend Indicator Board Online
Executive Summary:
- The short-term Trend Model has slipped to neutral - albeit by the slimmest of margins.
- The short-term Channel Breakout System remains positive. A break below 2428 early in the week and 2444 later in the week would turn the indicator negative.
- The intermediate-term Trend Model is currently positive. However a move below 2450 would cause a change.
- The intermediate-term Channel Breakout System continues on its 8/22 Buy signal. A break below 2417 flips the indicator to red.
- The long-term Trend Model remains positive.
- The Cycle Composite continues to point lower into mid-October.
- All three Trading Mode models call this a mean-reverting environment.
- In sum, we'll call the trend board modestly positive, but only by a slim margin.
The State of Internal Momentum
Next up are the momentum indicators, which are designed to tell us whether there is any "oomph" behind the current trend...
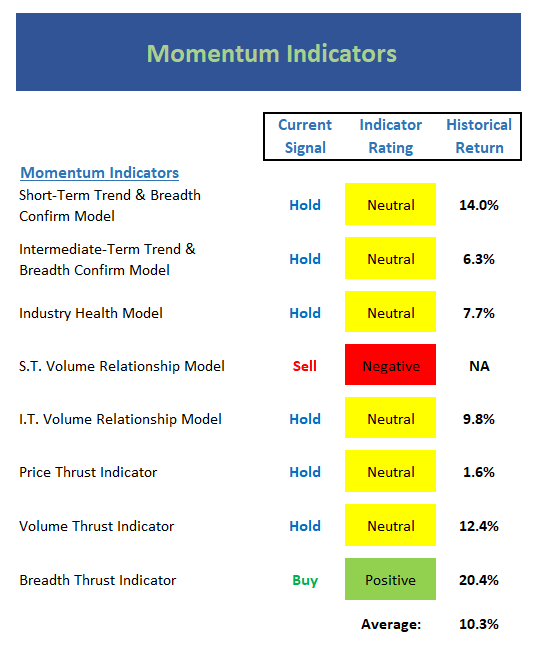
View Momentum Indicator Board Online
Executive Summary:
- Both the short- and intermediate-term Trend and Breadth Confirm Models slipped to neutral last week.
- The Industry Health Model remains stuck in the neutral zone
- The short-term Volume Relationship continues negative and up-volume is now at the lowest level seen since mid-2014
- The intermediate-term Volume Relationship continues to struggle with Demand Volume still in a clear downtrend.
- The Price Thrust Indicator managed to get up off the mat last week and remains neutral here.
- The Volume Thrust Indicator is also neutral to start the week.
- The Breadth Thrust Indicator remains positive by a small margin.
- In sum, the momentum board is largely neutral as there isn't any real "oomph" in the market at this time.
The State of the "Trade"
We also focus each week on the "early warning" board, which is designed to indicate when traders may start to "go the other way" -- for a trade.
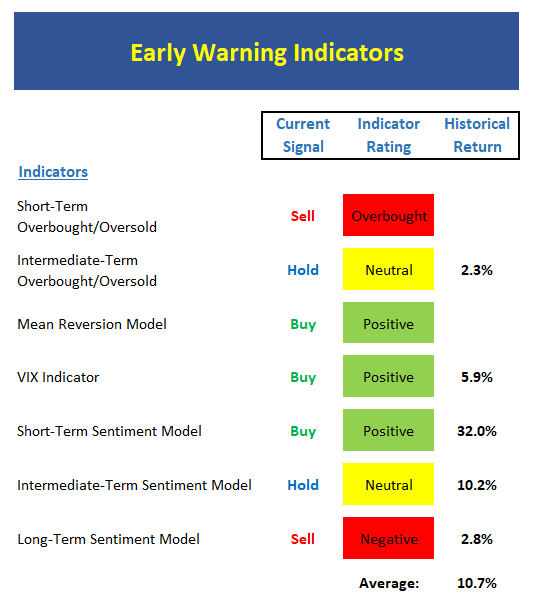
View Early Warning Indicator Board Online
Executive Summary:
- From a near-term perspective, stocks are now retreating from an overbought condition.
- From an intermediate-term view, stocks are neutral as the movement has been largely sideways for several months.
- The Mean Reversion Model has flipped to green and suggests that there is some upside potential here.
- The VIX Indicators remain on buy signals but are currently stuck in never-land.
- From a short-term perspective, market sentiment has deteriorated, which is a positive.
- The intermediate-term Sentiment Model remains neutral
- Longer-term Sentiment readings continue to suggest a great deal of complacency in the market, which is a negative.
- In sum, the early warning board suggests neither team has an edge here.
The State of the Macro Picture
Now let's move on to the market's "external factors" - the indicators designed to tell us the state of the big-picture market drivers including monetary conditions, the economy, inflation, and valuations.
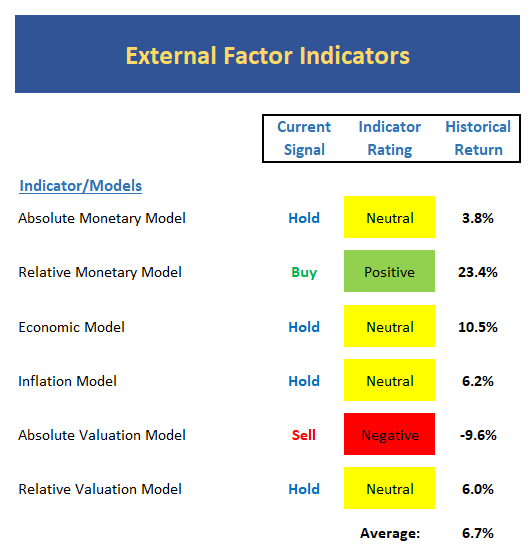
View External Factors Indicator Board Online
Executive Summary:
- Absolute Monetary conditions remain in the neutral zone this week where historical returns have been mediocre at best.
- With rates having moved to the lows for the year, the Relative Monetary Model continues to improve. This model is now solidly positive.
- Our Economic Model (designed to call the stock market) is neutral, which has led to returns on par with historical averages over time. It is worth noting that the Economic Model designed to call the economy continues to point to strong GDP growth.
- The Inflation Model is now smack in the middle of the neutral zone. This tells us there is little in the way of inflationary pressures in the system.
- The Absolute Valuation Model suggests stocks are still very expensive.
- However, the Relative Valuation Model continues to improve and is very close to a bullish reading.
The State of the Big-Picture Market Models
Finally, let's review our favorite big-picture market models, which are designed to tell us which team is in control of the prevailing major trend.
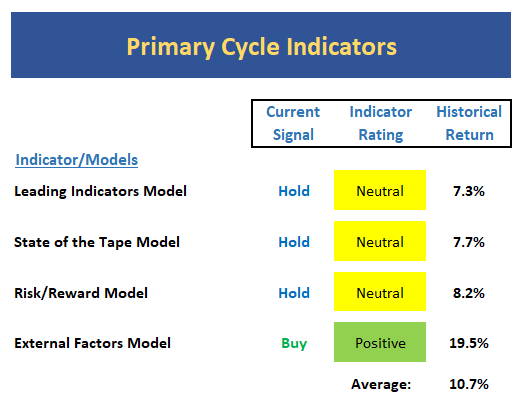
View My Favorite Market Models Online
Executive Summary:
- The Leading Indicators model, which was our best performing timing model during the last cycle, is now heading in the right direction again - but still neutral.
- The market's leadership remains narrow, which causes our "State of the Tape" model to flash yellow.
- The Risk/Reward model slipped back to neutral this week. Thus, we need to recognize that this is not a low-risk environment.
- The External Factors model remains positive this week, but the model reading is well below that seen at the beginning of the current cyclical bull in early-2016.
The Takeaway...
Let's see here… the trend of the market is between neutral and moderately positive, momentum is neutral, the early warning board doesn't give either team an edge, the external factors are modestly positive, and my favorite big-picture models are sporting a largely yellow. At the same time, we must recognize that this is a bull market until proven otherwise. So, given the we remain in a seasonally weak period until at least the middle of October and there are several "issues" in the market these days, this is probably a good time to "chill" from a trading perspective. However, the bulls should be given the benefit of any doubt from a longer-term perspective - and the dips should be bought.
Publishing Note: I am traveling the first half of the week and then preparing for my son's wedding at the end of the week. So, unless something major occurs in the markets, I will see you next week.
Thought For The Day:
It's not the load that breaks you down, it's the way you carry it. -Lou Holtz
Current Market Drivers
We strive to identify the driving forces behind the market action on a daily basis. The thinking is that if we can both identify and understand why stocks are doing what they are doing on a short-term basis; we are not likely to be surprised/blind-sided by a big move. Listed below are what we believe to be the driving forces of the current market (Listed in order of importance).
1. The State of Geopolitics
2. The State of the Economic/Earnings Growth (Fast enough to justify valuations?)
3. The State of the Trump Administration
4. The State of Fed Policy
Wishing you green screens and all the best for a great day,

David D. Moenning
Chief Investment Officer
Sowell Management Services
Disclosure: At the time of publication, Mr. Moenning and/or Sowell Management Services held long positions in the following securities mentioned: none. Note that positions may change at any time.
Disclosures
The opinions and forecasts expressed herein are those of Mr. David Moenning and may not actually come to pass. Mr. Moenning's opinions and viewpoints regarding the future of the markets should not be construed as recommendations. The analysis and information in this report is for informational purposes only. No part of the material presented in this report is intended as an investment recommendation or investment advice. Neither the information nor any opinion expressed constitutes a solicitation to purchase or sell securities or any investment program.
Any investment decisions must in all cases be made by the reader or by his or her investment adviser. Do NOT ever purchase any security without doing sufficient research. There is no guarantee that the investment objectives outlined will actually come to pass. All opinions expressed herein are subject to change without notice. Neither the editor, employees, nor any of their affiliates shall have any liability for any loss sustained by anyone who has relied on the information provided.
The analysis provided is based on both technical and fundamental research and is provided "as is" without warranty of any kind, either expressed or implied. Although the information contained is derived from sources which are believed to be reliable, they cannot be guaranteed.
David D. Moenning is an investment adviser representative of Sowell Management Services, a registered investment advisor. For a complete description of investment risks, fees and services, review the firm brochure (ADV Part 2) which is available by contacting Sowell. Sowell is not registered as a broker-dealer.
Employees and affiliates of Sowell may at times have positions in the securities referred to and may make purchases or sales of these securities while publications are in circulation. Positions may change at any time.
Investments in equities carry an inherent element of risk including the potential for significant loss of principal. Past performance is not an indication of future results.
Advisory services are offered through Sowell Management Services.
Recent free content from FrontRange Trading Co.
-
 Is The Bull Argument Too Easy These Days?
— 8/31/20
Is The Bull Argument Too Easy These Days?
— 8/31/20
-
What Do The Cycles Say About 2020?
— 1/21/20
-
Modeling 2020 Expectations (Just For Fun)
— 1/13/20
-
Tips From Real-World Wendy Rhoades
— 5/06/19
-
The Best Recession Ever!
— 4/29/19
-
{[comment.author.username]} {[comment.author.username]} — Marketfy Staff — Maven — Member


- 1 Campus Martius, Suite #200Detroit, MI 48226
- +1 877 440 9464